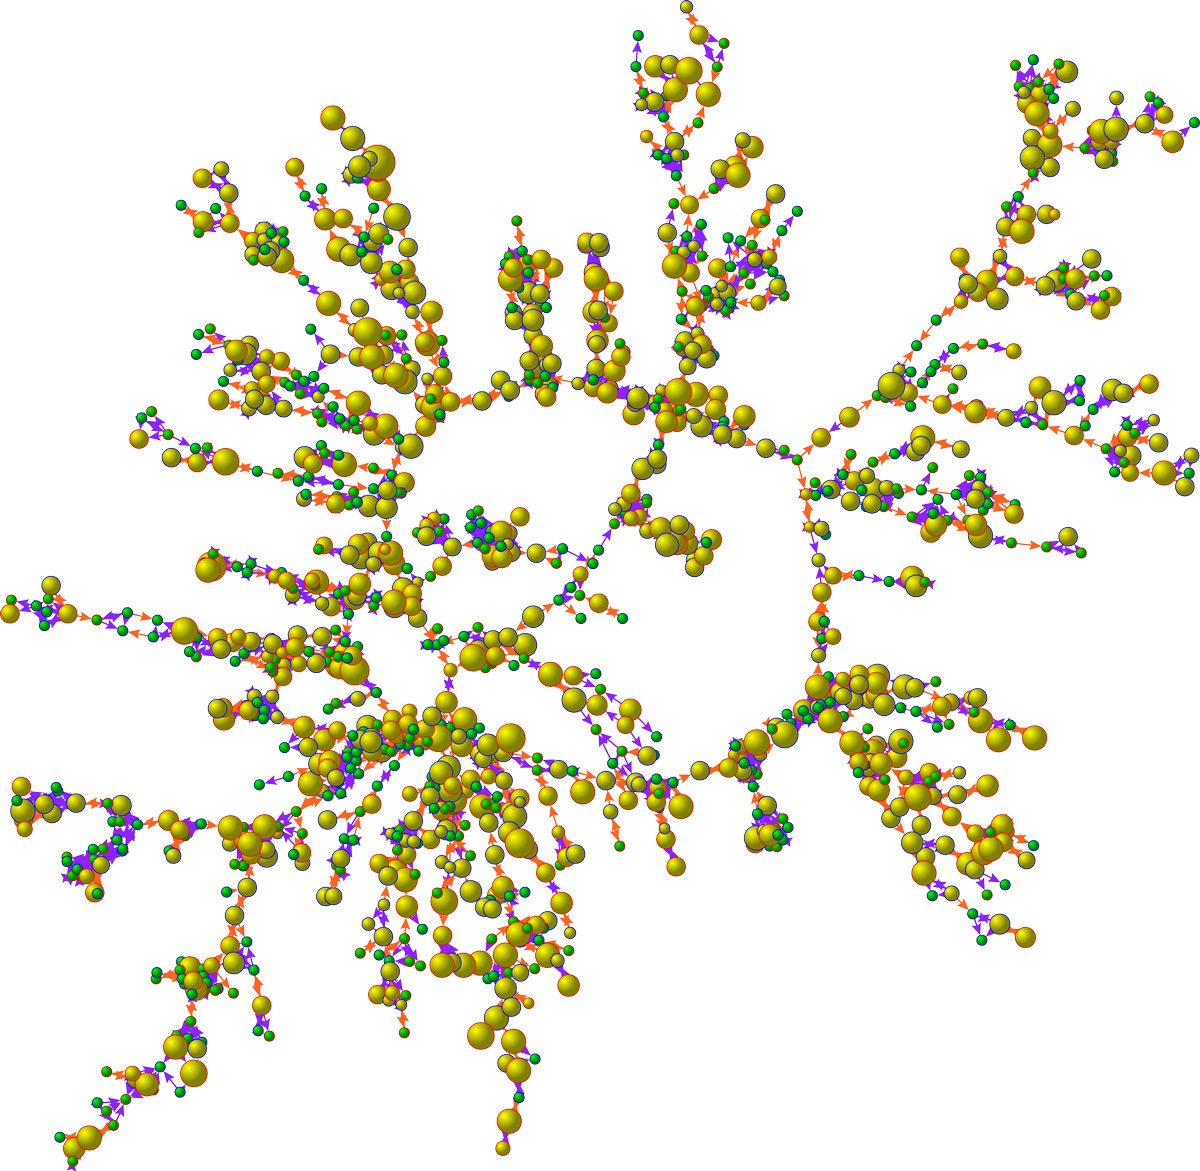
Smoking in a Face-to-Face Network in 1971
This graph shows a sample of 1,000 individuals selected from the largest connected subcomponent in 1971 from the Framingham Heart Study Social Network. Each node represents one person. Each circle (node) represents one person. Circles with red borders denote women, and circles with blue borders denote men. The interior color of the circles indicates the person’s cigarette consumption (yellow denotes ≥1 cigarette per day, and green denotes no cigarettes). The size of each circle is proportional to the number of cigarettes consumed. The colors of the ties between the circles indicate the relationship between them: orange denotes a friendship or a marital tie, and purple denotes a familial tie. For more details, see: N.A. Christakis and J.H. Fowler, “The Collective Dynamics of Smoking in a Large Social Network,” New England Journal of Medicine 2008; 358: 2249-2258.