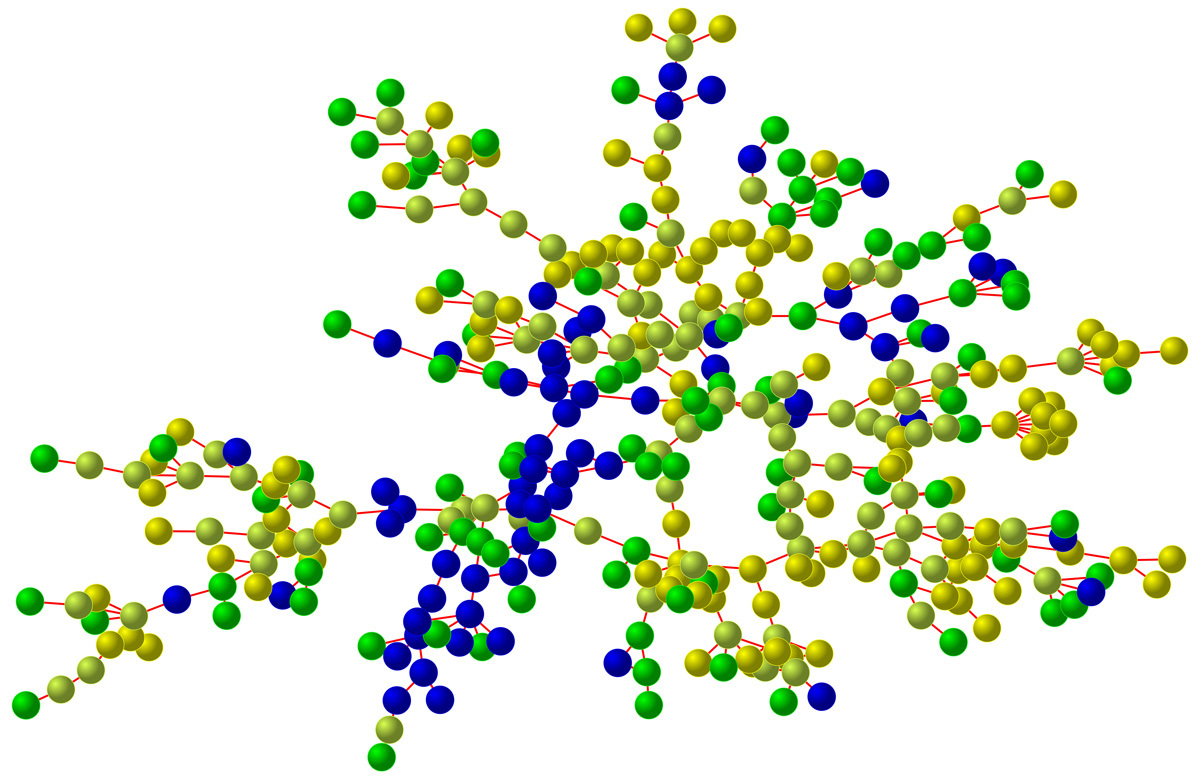
Smiling in a Facebook Network
This graph shows a subcomponent drawn from a network of 1,700 undergraduate students whose social ties were ascertained using Facebook. Each node represents one person and ties between them indicate a close friendship. Node color denotes the happiness of the subject, with blue shades indicating the least happy and yellow shades indicating the happiest people (shades of green are intermediate). The graph suggests clustering in happiness and unhappiness within this online network, and it suggests a relationship between being peripheral and being unhappy. For more details, see: N.A. Christakis and J.H. Fowler, “Social Network Visualizations in Epidemiology,” Norwegian Journal of Epidemiology 2009; 19: 5-16.