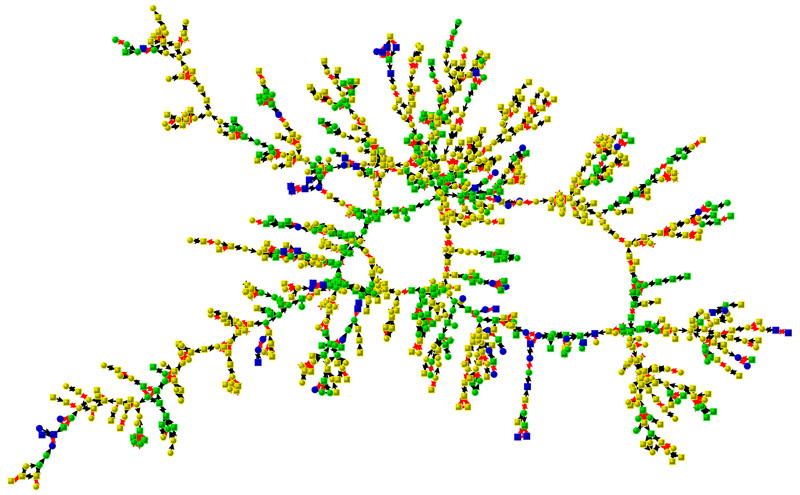
Loneliness in a Face-to-Face Network in 2000
This graph shows the largest connected subcomponent of friends, spouses, and siblings involving 1,019 individuals in 2000 from the Framingham Heart Study Social Network. Each node represents one person, and its shape denotes gender (circles are female, squares are male). Lines between nodes indicate relationship (red for siblings, black for friends and spouses). Node color denotes the mean number of days the individual felt lonely in the past week, with yellow being 0–1 days, green being 2 days, and blue being 3 days or more. The graph suggests clustering in loneliness and a relationship between being peripheral and feeling lonely, both of which are confirmed by statistical models discussed in the paper. For more details, see: J.T. Cacioppo, J.H. Fowler, and N.A. Christakis, “Alone in the Crowd: The Structure and Spread of Loneliness in a Large Social Network,” Journal of Personality and Social Psychology 2009; 97: 977-991.