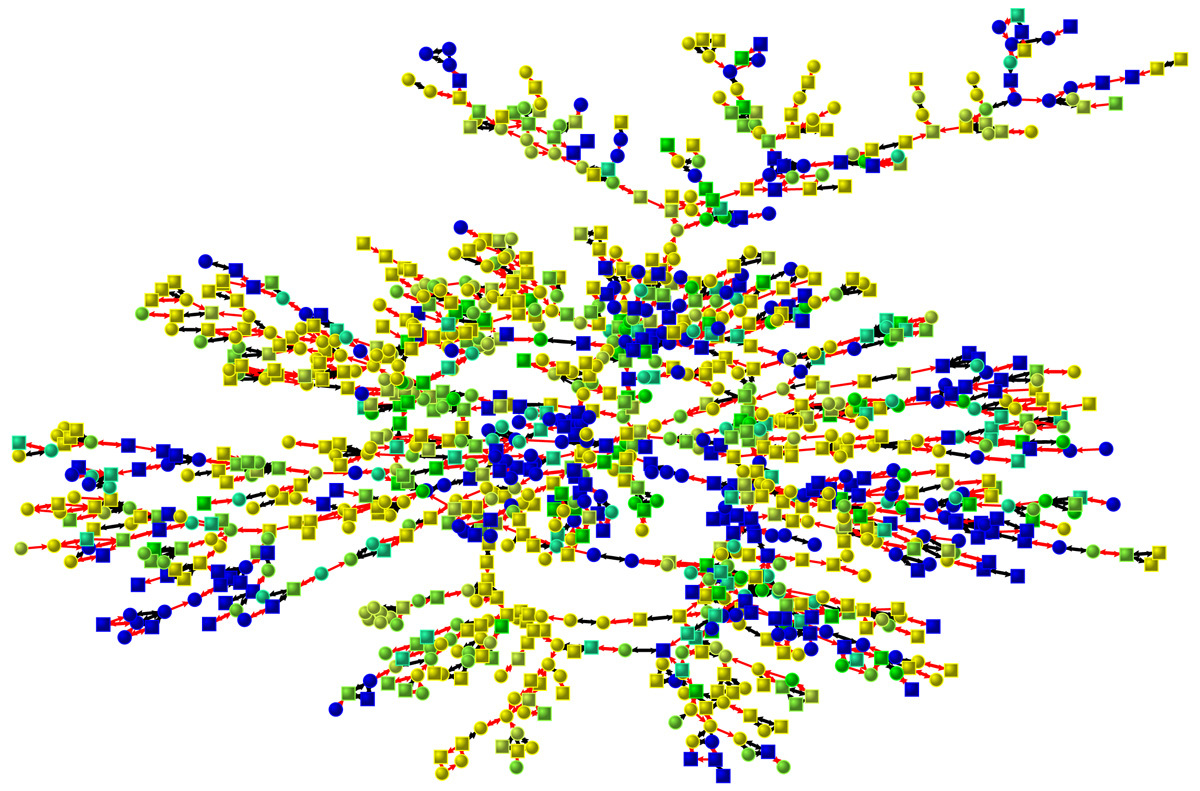
Happiness in a Face-to-Face Network in 1996
This graph shows the largest connected subcomponent of friends, spouses, and siblings involving 1,181 individuals in 1996 from the Framingham Heart Study Social Network. Each node represents one person (circles are female, squares are male). Lines between nodes indicate relationship (black for siblings, red for friends and spouses). Node color denotes the happiness of the subject, with blue shades indicating the least happy and yellow shades indicating the happiest individuals (shades of green are intermediate). The graph suggests clustering in happiness and unhappiness within the network, and it suggests a relationship between being peripheral and being unhappy, both of which are confirmed by statistical models discussed in the paper. For more details, see: J.H. Fowler and N.A. Christakis, “Dynamic Spread of Happiness in a Large Social Network: Longitudinal Analysis Over 20 Years in the Framingham Heart Study,” British Medical Journal 2008; 337: a2338 (doi:10.1136/bmj.a2338).